Run Chart: Tracking Process Variation Over Time
A free online reference for statistical process control, process capability analysis, measurement systems analysis,
control chart interpretation, and other quality metrics.
SPC DEMO
Minimize Production Costs, Quickly Detect Issues, and Optimize Your Product Quality
Don’t miss out! Book a demo of our specialized SPC software and unlock immediate improvements in your processes.
- Quality Advisor
- Data Collection Tools
- Data Analysis Tools
- Formulas and Tables
- Glossary
- Additional Resources
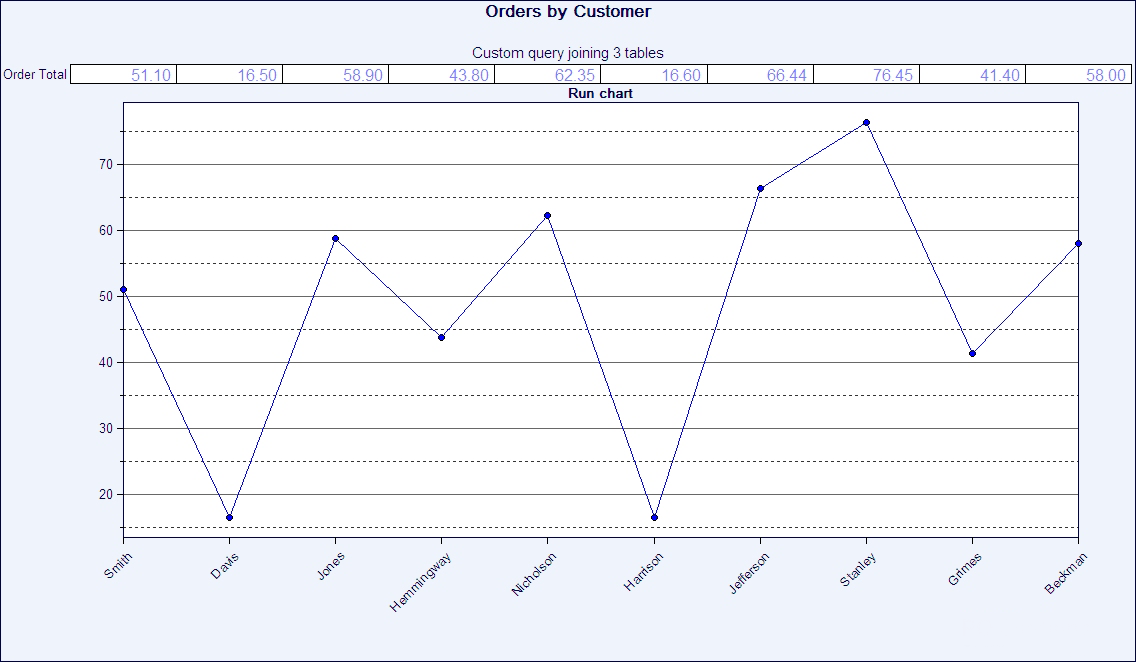
Run chart
What is it?
A run chart is a line graph of data plotted over time. By collecting and charting data over time, you can find trends or patterns in the process. Because they do not use control limits, run charts cannot tell you if a process is stable. However, they can show you how the process is running. The run chart can be a valuable tool at the beginning of a project, as it reveals important information about a process before you have collected enough data to create reliable control limits.
What does it look like?
Run charts show individual data points in chronological order.
Additional reference material
Additional sections from legacy run-chart-interpretation:
Run chart interpretation
To analyze run charts:
- Look for runs.
If you find seven or more points in a row rising or falling, you have found an unusual circumstance that calls for investigation. Finding evidence of a run is neither good nor bad. It simply raises a flag that says “ask why.” - Look for other nonrandom patterns.
You may find a repeating pattern that corresponds to other data. Any nonrandom or repeating pattern is cause for investigation. If you find no unusual patterns, you may notice differences among readings. Do they swing from highs to lows or are they quite similar to each other? Further analysis by control chart is the next likely step.
To create run charts that will highlight these patterns, use software such as SQCpack.
Reviewed by
Quality & SPC review panel
Articles on statistical process control, capability indices, control charts, and quality management are reviewed by the product teams behind InfinityQS, WinSPC, and PQ Systems (SQCpack and GAGEpack) — the SPC and quality platforms deployed across food, automotive, pharma, and CPG manufacturers.